 There’s a lot of economic data that I follow that rarely makes it into my columns in the Savannah Morning News.
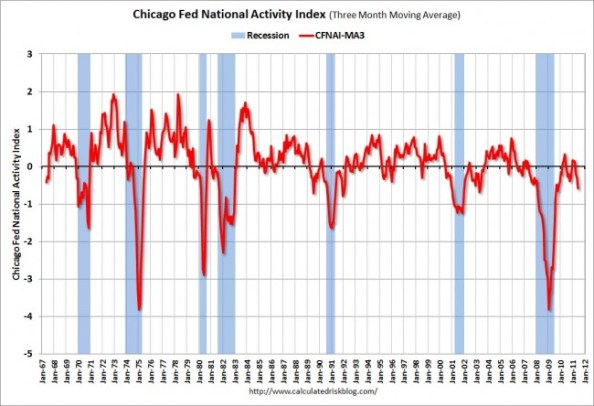
That’s certainly true for the Chicago Fed National Activity Index, which I check monthly but rarely mention in print. It’s one of many indices that I follow via the website Calculated Risk. Here’s CR’s graph updated with the June CFNAI index reading:
It’s a good index to follow for a variety of reasons. The Chicago Fed defines it this way:
The index is a weighted average of 85 indicators of national economic activity.The indicators are drawn from four
broad categories of data: 1) production and income; 2) employment, unemployment, and hours; 3) personal consumption
and housing; and 4) sales, orders, and inventories.
More people would follow it, I imagine, if the scale made more sense. Essentially, zero indicates normal trend growth in the economy. Positive numbers are above-trend, and negative are below-trend, but as long as the numbers are above -.70, we probably aren’t in recession. The reading for June was -.46, up slightly from the -.55 in May. The 3-month moving average declined, however, to -.60. The current press release is here.
Note on the graph that recessions are typically followed by periods of above-trend growth. But not this time — and no surprise. Recoveries from financial crises are typically choppy, and the excess capacity and slack in the economy is preventing the usual surges in fields like construction.
